
2025 年 4 月市场回顾
The markets delivered massive losses in April and then recovered somewhat as investors tried to come to terms with the White House’s unbounded and erratic tariff policies. Gross Domestic Product (GDP) went negative during the first quarter for the first time since 2022 as imports surged and consumer spending tumbled. Consumer confidence marked a 13-year low during April, citing the uncertainty and negative impact of tariffs. Meanwhile, gold soared again, hitting record highs.
Investors Rattled in April But Regain Footing
The markets went on a roller coaster in April as investors experienced a litany of tariff policy reversals and missteps from the White House. At one point during the month, the S&P 500® (SPX) was down more than 11% and off by nearly 20% from its February record. Toward the end of the month, the markets relaxed somewhat as the White House walked back stiffer duties. The SPX and the Dow Jones Industrial Average® (DJIA) managed to pull together a week’s worth of up days to close out the month. All told, the SPX lost just under 1% in April while the DJIA lost over 3% and the NASDAQ Composite Index (COMP) eked out a gain of under 1%. Extremely high levels of uncertainty remain as businesses and consumers grapple with what the long-term tariff picture will look like and what that will mean for prices, profits, and growth.
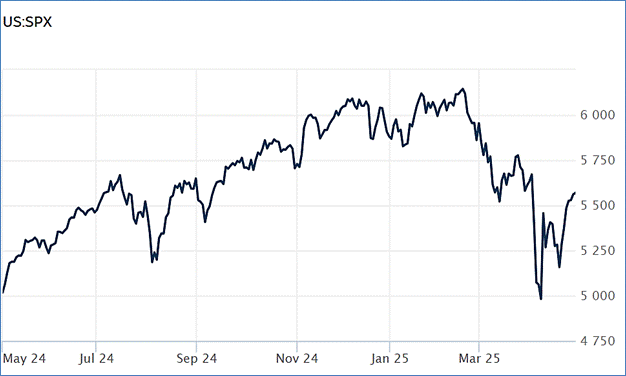
Source: Wall Street Journal
Economic Growth Shrinks
The US economy went negative during the first quarter of 2025 with GDP shrinking at an annual rate of 0.3%, according to the latest numbers from the Bureau of Economic Analysis. That marked the first quarter of negative growth since the beginning of 2022 and was significantly off the 2.4% positive pace set at the close of 2024. The 0.3% loss was also well below the 0.4% gain that economists were expecting.
Driving the poor showing was a 41% increase in imports — including a 51% increase in goods imports – as consumers and businesses scrambled to buy goods from overseas before the White House’s tariffs gained full speed in April. Outside the Covid pandemic, April’s import growth number was the biggest since 1974.
Since imports subtract from GDP, some may view the report as less negatively as others since imports are likely to cool as tariffs begin taking effect. But the report also revealed that consumer spending – which accounts for 75% of all economic activity – increased just 1.8% for the period, marking the smallest gain in spending since the second quarter of 2023 and was significantly below the 4% rate garnered during the last quarter of 2024. CNBC
Consumer Confidence at 13-year Low
How consumers feel about their current and future economic lives was slammed again in April, with the Conference Board Consumer Confidence Index® falling to 86, the lowest level in nearly five years and worse than expectations, which called for a reading of 88. The negative impact and uncertainty surrounding tariffs was front and center.
But as dismal as the overall reading was, how consumers feel about the future deteriorated more: The expectations index dropped 12 points to 54, marking the lowest level since October 2011 and significantly below the threshold of 80, which typically indicates a recession ahead.
Expectations about future income prospects turned negative for the first time in five years while high stock market volatility pushed consumers’ feelings about stocks deeper into negative territory: 48% of consumers now believe stocks will decline over the next year.
According to Stephanie Guichard, Senior Economist, Global Indicators at The Conference Board, “consumer confidence declined for a fifth consecutive month in April, falling to levels not seen since the onset of the COVID pandemic. The decline was largely driven by consumers’ expectations. The three expectation components — business conditions, employment prospects, and future income — all deteriorated sharply, reflecting pervasive pessimism about the future.” Conference Board
Gold at Record Levels
Tariff fears and uncertainty that have consumers wringing their hands has also put gold on a record trajectory. A recent price for the yellow metal stood at $3,330 per ounce, a record price, and up a staggering 41% compared to a year-ago.
Record gold prices are likely driven by worried investors looking for a safe haven for their assets. Many see gold as a store of value that other assets can’t possess. Gold has long been an alternative for investors when geopolitical tensions are high, which is clearly the case in many regions around the world.
Many also believe higher gold prices are due to the uncertainty regarding the White House’s confusing and volatile tariff policy. That uncertainty has ignited fears over a broad and engulfing trade war among many of the world’s biggest economies. The implications of such a trade war have both consumers and businesses worried. As a result, gold buying is way up.
Central banks are also buying gold for a variety of reasons. Likely the biggest is protectionist: Gold can tend to insulate a country’s economy from the potential fallout from global uncertainty, tariffs, and sanctions. Adding to gold stockpiles can make central bankers – just like consumers – feel safer. AP News
This research material was prepared by Burritt Research, Inc.
This material represents an assessment of the market and economic environment at a specific point in time and is not intended to be a forecast of future events, or a guarantee of future results. Forward-looking statements are subject to certain risks and uncertainties. Actual results, performance, or achievements may differ materially from those expressed or implied. Information is based on data gathered from what we believe are reliable sources. It is not guaranteed as to accuracy, does not purport to be complete and is not intended to be used as a primary basis for investment decisions. It should also not be construed as advice meeting the particular investment needs of any investor. Past performance does not guarantee future results.
Indices are unmanaged and investors cannot invest directly in an index. Unless otherwise noted, performance of indices does not account for any fees, commissions or other expenses that would be incurred. Returns do not include reinvested dividends.
The Standard & Poor’s 500 (S&P 500) is an unmanaged group of securities considered to be representative of the stock market in general. It is a market value weighted index with each stock’s weight in the index proportionate to its market value.
The Nasdaq Composite Index is a market-capitalization weighted index of the more than 3,000 common equities listed on the Nasdaq stock exchange. The types of securities in the index include American depositary receipts, common stocks, real estate investment trusts (REITs) and tracking stocks. The index includes all Nasdaq listed stocks that are not derivatives, preferred shares, funds, exchange-traded funds (ETFs) or debentures.
The Dow Jones Industrial Average (DJIA) is a price-weighted average of 30 actively traded “blue chip” stocks, primarily industrials, but includes financials and other service-oriented companies. The components, which change from time to time, represent between 15% and 20% of the market value of NYSE stocks.
The Conference Board creates the Present Situation Index (PSI) from survey data of approximately 5000 households across the United States to gauge public opinion about the US economy. When the index is positive, people feel good about the current economic situation. When negative, people are less optimistic. The (PSI) along with the Expectations Index are used by The Conference Board to create the Consumer Confidence Index (CCI) which tells us how optimistic (or not) people are about the future of the economy.
The Expectations Index is a component of the Consumer Confidence Index® (CCI), which is published each month by the Conference Board. The CCI reflects consumers’ short-term—that is, six-month—outlook for, and sentiment about, the performance of the overall economy as it effects them. The Expectations Index is made up of the average of the CCI components that deal with six-month outlooks for business, employment, and income.
©2025 Wealthcare Capital Management LLC, Wealthcare Advisory Partners LLC, and Wealthcare Capital Partners LLC (“Wealthcare”) is a registered investment advisor with the US Securities and Exchange Commission (SEC) under the Investment Advisors Act of 1940. All Rights Reserved.
Information contained herein is at a point in time and subject to change without notice. Information is derived from sources which are believed to be reliable but are not independently audited.
This content is for informational purposes only and is not advice for any individual or a recommendation of any specific investment product or strategy. Wealthcare cannot guarantee any specific financial return results for any client or guarantee a client will in all circumstances of changing personal financial goals and market conditions be able to remain in a client’s Wealthcare Plan Comfort Zone®. Past performance is not a guide to future returns. All investments carry a degree of risk of loss of principal and there is no assurance that an investment will provide positive performance over any period of time.

Two James Center, 1021 East Cary Street, Suite 702 | RICHMOND, VA 23219 | 804.644.4711
WealthcareGDX.com