

August 2025 Market Recap
Stocks continued to soar to record levels in August as investors digested a fresh set of strong economic and earnings reports. The Federal Reserve’s (Fed) preferred inflation gauge edged up slightly in July, indicating that the Trump Administration’s trade policies have begun pushing prices higher. Consumer confidence worsened slightly in August, but not outside the current trend. Gold price set new highs once again as geopolitical and economic uncertainty continued to rise.
Market Shrug Off Tariff Noise
The markets continued their surge higher during August, printing a brand new set of highs. The popular Dow Jones Industrial Average® (DJIA) led the march during the month, gaining 3.2%, and capping its fourth straight monthly gain. The broad market S&P 500® (SPX) was up 1.9% during August, also delivering its fourth monthly gain in a row. The tech-heavy NASDAQ Composite Index (COMP) saw August book its fifth straight monthly gain, up 1.6% on the month.
The markets continue to be buoyed by a steady march of solid economic reports, favorable earnings results, and the ongoing strong outlook surrounding AI and the “productivity boom.” The markets also appear to continue to brush off the uncertainty surrounding the long-term effects of the Trump Administration’s trade policies, despite indications that price pressures are beginning to surface. But the strongest support for stock prices is likely to come from the broad hope that the Fed may lower rates during their September meeting.
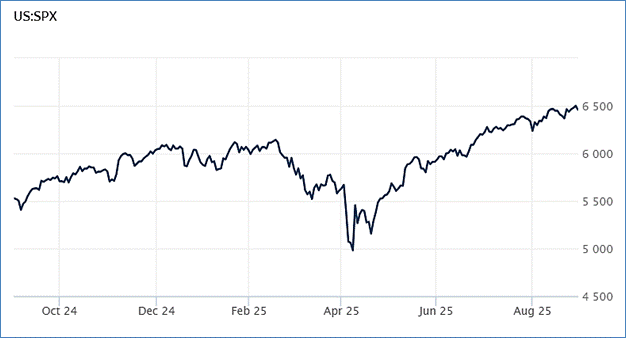
Source: Wall Street Journal
Core Inflation Climbs
According to the latest data from the Bureau of Economic Analysis, the core personal consumption expenditures index (PCE) — the Fed’s preferred inflation measure — recorded a seasonally adjusted annual rate of 2.9% during July. While the measure was in line with expectations, it ticked up from June, marked the highest rate since February, and is considerably above the Fed’s 2% target. Considering all items, inflation was up 2.6% in July compared to a year ago, also meeting expectations. July’s report now supports the belief that the Trump administration’s trade policies have begun their upward push on prices.
On the positive side, consumer spending increased 0.5% for the month, in line with estimates and showing the US consumer remains resilient despite higher prices. With consumer spending accounting for two-thirds of economic activity in the US, the latest reports indicate a continuously robust consumer sector. Personal income also accelerated 0.4%. CNBC
Consumer Confidence Sours – Many Expect Lower Stock Prices
The Conference Board Consumer Confidence Index® dropped 1.3 points in August to 97.4. The results were higher than expected but in line with the trend over the past three months. The Present Situation Index – which measures consumers’ feelings about current business and labor conditions – fell 1.6 points to 131.2.
How consumers feel about the short-term outlook for income, business, and labor decreased by 1.2 to 74.8. Notably, consumers’ appraisal of current job availability continued to sour for the eighth straight month. Optimism about future income also faded.
How consumers feel about stocks also deteriorated in August, with only 47.4% of consumers expecting stock prices to rise over the next 12 months. That’s down from 48.9% in July. Conference Board
Gold Soars as Uncertainty Rises
Gold continues to record levels. A recent price for the futures gold contract and spot gold stood at a record high of $3,516 and $3,447 an ounce, respectively. Gold has been on an upward trend for most of the past two years.
The biggest driver of higher gold prices right now is geopolitical and economic uncertainty. When these go up, investors and central banks tend to look for safe-haven assets that retain their value in uncertain and harsh economic conditions. Gold has traditionally been the star of this category.
Another big driver of higher gold prices is structural demand from gold ETFs (Exchange Traded Funds), central banks, and sovereign wealth funds. These institutional buyers tend to accumulate gold as a matter of doing business, which puts steady pressure on higher gold prices. Many players are also diversifying away from the US dollar and buying gold instead.
The weakening US dollar is also playing a role in higher gold prices. More than normal uncertainty over the outlook for US interest rates tends to make the US dollar less attractive, putting downward pressure on the dollar. Since gold is denominated and traded in US dollars, a lower US dollar means gold prices are relatively cheaper for owners of foreign currencies. As a result, gold tends to move higher as the US dollar weakens. CBS
This research material was prepared by Burritt Research, Inc.
This material represents an assessment of the market and economic environment at a specific point in time and is not intended to be a forecast of future events, or a guarantee of future results. Forward-looking statements are subject to certain risks and uncertainties. Actual results, performance, or achievements may differ materially from those expressed or implied. Information is based on data gathered from what we believe are reliable sources. It is not guaranteed as to accuracy, does not purport to be complete and is not intended to be used as a primary basis for investment decisions. It should also not be construed as advice meeting the particular investment needs of any investor. Past performance does not guarantee future results.
Indices are unmanaged and investors cannot invest directly in an index. Unless otherwise noted, performance of indices does not account for any fees, commissions or other expenses that would be incurred. Returns do not include reinvested dividends.
The Standard & Poor’s 500 (S&P 500) is an unmanaged group of securities considered to be representative of the stock market in general. It is a market value weighted index with each stock’s weight in the index proportionate to its market value.
The Nasdaq Composite Index is a market-capitalization weighted index of the more than 3,000 common equities listed on the Nasdaq stock exchange. The types of securities in the index include American depositary receipts, common stocks, real estate investment trusts (REITs) and tracking stocks. The index includes all Nasdaq listed stocks that are not derivatives, preferred shares, funds, exchange-traded funds (ETFs) or debentures.
The Dow Jones Industrial Average (DJIA) is a price-weighted average of 30 actively traded “blue chip” stocks, primarily industrials, but includes financials and other service-oriented companies. The components, which change from time to time, represent between 15% and 20% of the market value of NYSE stocks.
The Conference Board creates the Present Situation Index (PSI) from survey data of approximately 5000 households across the United States to gauge public opinion about the US economy. When the index is positive, people feel good about the current economic situation. When negative, people are less optimistic. The (PSI) along with the Expectations Index are used by The Conference Board to create the Consumer Confidence Index (CCI) which tells us how optimistic (or not) people are about the future of the economy.
The Expectations Index is a component of the Consumer Confidence Index® (CCI), which is published each month by the Conference Board. The CCI reflects consumers’ short-term—that is, six-month—outlook for, and sentiment about, the performance of the overall economy as it effects them. The Expectations Index is made up of the average of the CCI components that deal with six-month outlooks for business, employment, and income.
©2025 Wealthcare Capital Management LLC, Wealthcare Advisory Partners LLC, and Wealthcare Capital Partners LLC (“Wealthcare”) is a registered investment advisor with the US Securities and Exchange Commission (SEC) under the Investment Advisors Act of 1940. All Rights Reserved.
Information contained herein is at a point in time and subject to change without notice. Information is derived from sources which are believed to be reliable but are not independently audited.
This content is for informational purposes only and is not advice for any individual or a recommendation of any specific investment product or strategy. Wealthcare cannot guarantee any specific financial return results for any client or guarantee a client will in all circumstances of changing personal financial goals and market conditions be able to remain in a client’s Wealthcare Plan Comfort Zone®. Past performance is not a guide to future returns. All investments carry a degree of risk of loss of principal and there is no assurance that an investment will provide positive performance over any period of time.
Two James Center, 1021 East Cary Street, Suite 702 | RICHMOND, VA 23219 | 804.644.4711
WealthcareGDX.com